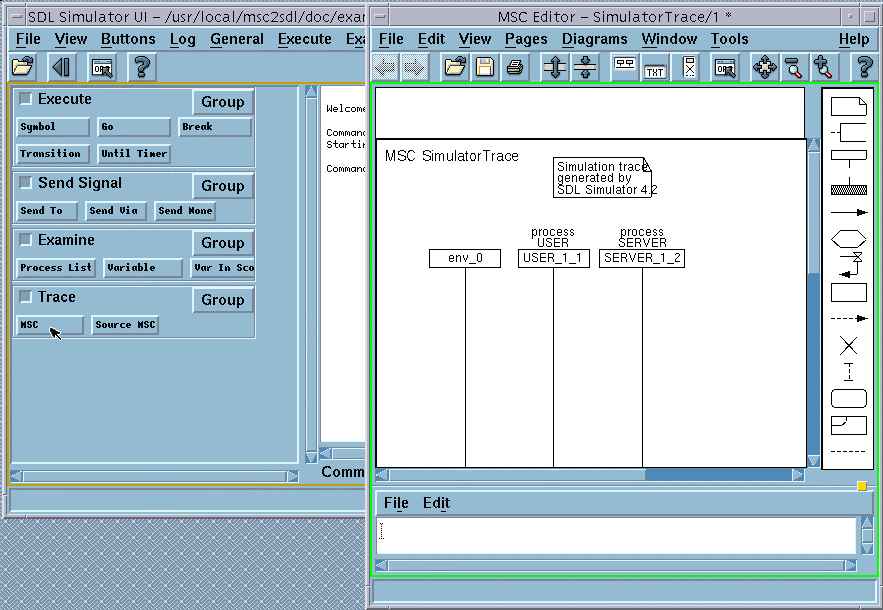
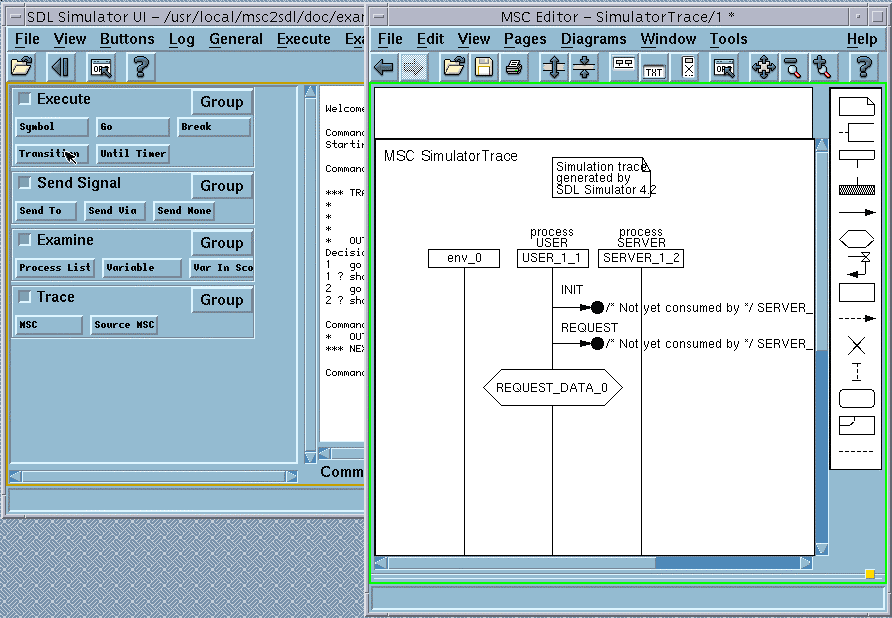
In the final part of this exercise on Viewing MSC traces, we will explore the capability of the KLOCwork MSC to SDL tool and the Telelogic Tau to produce graphical execution traces as MSCs.

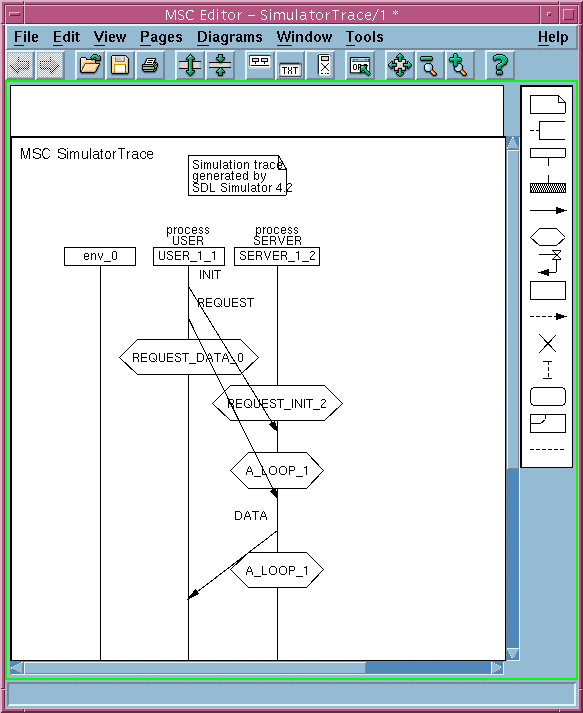
Note that the MSC trace in the MSC Editor shows three instance axes. Instances with names USER_1_1 and SERVER_1_2 correspond to the instances of the input MSC model. The third instance, named env_0, corresponds to the environment of the system. This additional instance is not involved in MSC trace at this step.


At its start transition, the User instance sends the Init message to the Server and then sends the message Request. Then it enters the state REQUEST_DATA_0 where it waits for the Server instance to reply. At the MSC trace diagram states are displayed as conditions.
At its start transition, the Server instance enters the state REQUEST_INIT_2, where it waits for connection request from the User instance. In this state, the Server receives the message Init from the User instance and performs transition to the state A_LOOP_1, which means that connection was successfully initialized.
Next, the Server receives message Request from the User and sends the Data message as the reply to the User. Then the Server returns to the state A_LOOP_1, where it waits for the next requests from the User.
The User receives the Data message from the Server, and this finishes the first data interchange between User and Server.
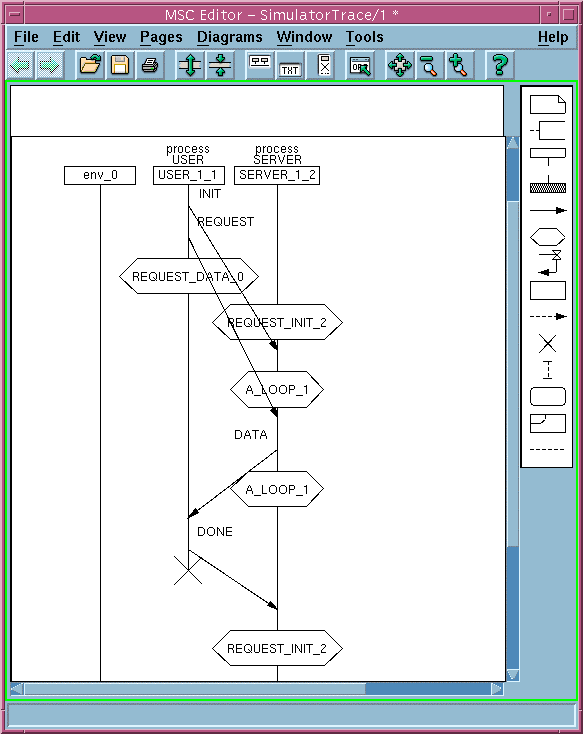
Events, which occur after this, are shown in the following figure.

The User instance sends the message Done to the Server and then stops its execution, which means that connection is terminated.
The Server instance receives the message Done from the User and performs transition to the state REQUEST_INIT_2, where it waits for the Init signal.
In this exercise we explored the KLOCwork MSC to SDL Synthesizer's capability for simulating MSCs.
In the next exercise we will produce and explore the SDL model, corresponding to the MSC model of our example.